library(igraph)
library(ADAPTSNA)10 Two Mode Network Data
It is possible for you to think about individuals connected to groups rather than other individuals. Think about your affiliations, subscriptions, memberships and social spheres. You might be a part of a professional organisation, subscriber to television streaming services, or extracurricular hobbies/groups. In social network parlance, we talk about this in terms of modes. Social network data can be one mode or two mode. So far, we have dealt with one mode network data. This means that one type of node is connected to the same type of node. Individuals connected to other individuals, for example. We can also measure networks where there are two types of node. These two mode networks allow us to measure how individuals are connected to groups.
| LEARNING ELEMENTS - Data Practices |
|---|
|
Getting to Know the Data
For this chapter we will use some unique data where individuals are connected to groups. Specifically, this dataset demonstrates characters from the Harry Potter books authored by J.K. Rowling who are connected to various groups across the series.
I identified various groups from the series and then researched which characters are participants in the groups. For example, I searched “list of prefects at Hogwarts.” Same for phoenix, death eaters etc. Most of the info came from https://harrypotter.fandom.com/wiki. I then checked each person on Google to see what house they were in - some are missing and NA because they are fake characters from the movies or the wiki page.
For this to truly be a two mode network, they have to be distinct. What this means is that those in the row cannot be in the columns. Note that each it must needs be possible for individuals to participate in any, many, all or none of the groups. If it is only possible for an individual to be in one, then this is more like a categorical variable. Once I confirmed this, I then structured these into an adjacency matrix and an edgelist. We will learn how to read both types of data into a network object and create a basic visualisation.
hp <- load_data("Harry Potter_Two_Mode_AM.csv", row.names=1)

hp_mat <- as.matrix(hp)

head(hp_mat)
Phoenix Dumbeldore.s.Army Death.Eaters Inquisitorial.Squad
Albus Dumbledore 1 0 0 0
Remus Lupin 1 0 0 0
Molly Weasley 1 0 0 0
Siruis Black 1 0 0 0
Severus Snape 1 0 1 0
Alastor Moody 1 0 0 0
Prefect Gryffindor Ravenclaw Hufflepuff Slytherin
Albus Dumbledore 1 1 0 0 0
Remus Lupin 1 1 0 0 0
Molly Weasley 0 1 0 0 0
Siruis Black 0 1 0 0 0
Severus Snape 0 0 0 0 1
Alastor Moody 0 0 0 1 0Two Mode Adjacency Matrices
So, here we have a two mode adjacency matrix. You will notice some things that are similar to you, perhaps the 1/0 nature of a matrix. But this is slightly different. The columns no longer reflect the same names as the rows. Now, instead of an i,j matrix we have an i,g (group) matrix. This means that there is no diagonal. Why? Well, because the names at the top of the matrix (columns) are different from the side (rows). Here then, i is sending to the group. Rather, we talk about this, usually, in terms of affiliation. So, i is affiliated with or a member the group (or not).
For R to understand this is a two mode network matrix converted into a network, we use a slightly different command than a regular graph_from_adjacency_matrix(). Instead, we use graph_from_biadjacency_matrix(). This is the function where R recognises the separate column names as one type of node and the row names as another.
hp_aff <- graph_from_biadjacency_matrix(hp_mat)Let’s take a look at this new object and get familiar with this type of network. Below you see that this is an undirected bipartite network (UN-B). Bipartite is simply another word for two mode (also called affiliation networks). There are 131 nodes and 252 edges in the network. Then, we have a new vertex attribute called ‘type.’ We will take a closer look at this.
hp_affIGRAPH 6a46883 UN-B 131 252 --
+ attr: type (v/l), name (v/c)
+ edges from 6a46883 (vertex names):
[1] Albus Dumbledore --Phoenix Albus Dumbledore --Prefect
[3] Albus Dumbledore --Gryffindor Remus Lupin --Phoenix
[5] Remus Lupin --Prefect Remus Lupin --Gryffindor
[7] Molly Weasley --Phoenix Molly Weasley --Gryffindor
[9] Siruis Black --Phoenix Siruis Black --Gryffindor
[11] Severus Snape --Phoenix Severus Snape --Death.Eaters
[13] Severus Snape --Slytherin Alastor Moody --Phoenix
[15] Alastor Moody --Hufflepuff Minerva McGonagall--Phoenix
+ ... omitted several edgesHere we see a vector with TRUE and FALSE statements for every node in the network. These statements serve as designations for which mode each node is. Those that are designated with a TRUE ‘type’ are one type of node (in this case, the groups) and those with a FALSE type are the individuals - the other type of node. We can use these as we create visualisations and further analyse two mode networks.
V(hp_aff)$type [1] FALSE FALSE FALSE FALSE FALSE FALSE FALSE FALSE FALSE FALSE FALSE FALSE
[13] FALSE FALSE FALSE FALSE FALSE FALSE FALSE FALSE FALSE FALSE FALSE FALSE
[25] FALSE FALSE FALSE FALSE FALSE FALSE FALSE FALSE FALSE FALSE FALSE FALSE
[37] FALSE FALSE FALSE FALSE FALSE FALSE FALSE FALSE FALSE FALSE FALSE FALSE
[49] FALSE FALSE FALSE FALSE FALSE FALSE FALSE FALSE FALSE FALSE FALSE FALSE
[61] FALSE FALSE FALSE FALSE FALSE FALSE FALSE FALSE FALSE FALSE FALSE FALSE
[73] FALSE FALSE FALSE FALSE FALSE FALSE FALSE FALSE FALSE FALSE FALSE FALSE
[85] FALSE FALSE FALSE FALSE FALSE FALSE FALSE FALSE FALSE FALSE FALSE FALSE
[97] FALSE FALSE FALSE FALSE FALSE FALSE FALSE FALSE FALSE FALSE FALSE FALSE
[109] FALSE FALSE FALSE FALSE FALSE FALSE FALSE FALSE FALSE FALSE FALSE FALSE
[121] FALSE FALSE TRUE TRUE TRUE TRUE TRUE TRUE TRUE TRUE TRUEWe can now create a visualisation of this network as we do all others.
plot(hp_aff,
     vertex.label = NA)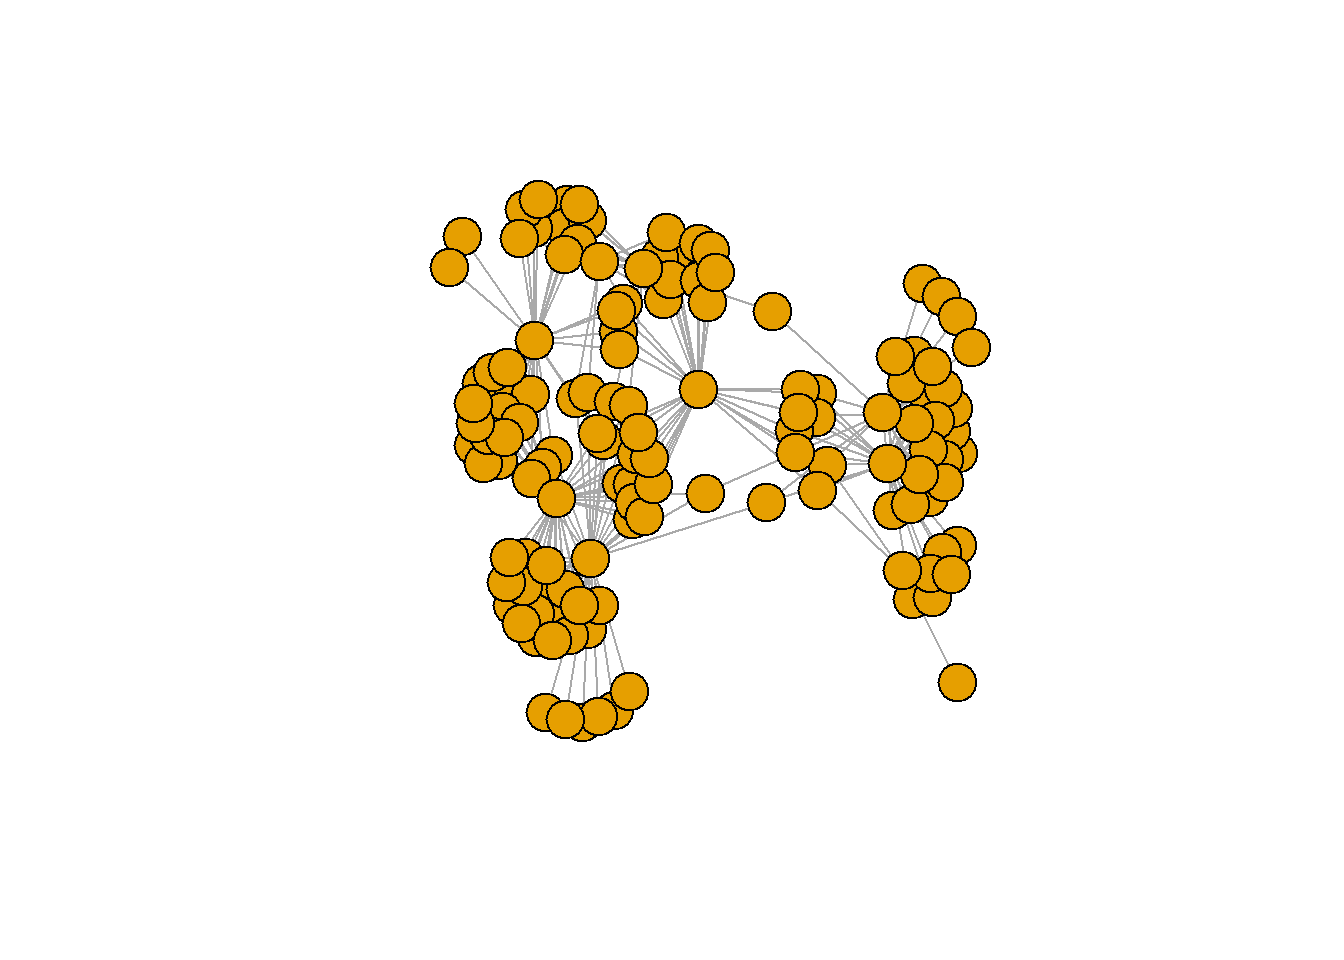
However, looking at this plot, you can’t tell if it is a one more or a two mode network since the nodes all look exactly the same. There are a few things we need to do in order to make this clearer that we will cover in later chapters. For now, lets just visualise the labels of the groups alone by utilising the ‘type’ characteristic.
par(mar =c(0,0,3,0))
set.seed(123)

plot(hp_aff,
     vertex.label = ifelse(V(hp_aff)$type == "TRUE", V(hp_aff)$name,""),
     vertex.size = ifelse(V(hp_aff)$type == "TRUE", 10,2),
     vertex.label.cex = 0.5, main = "Harry Potter Network")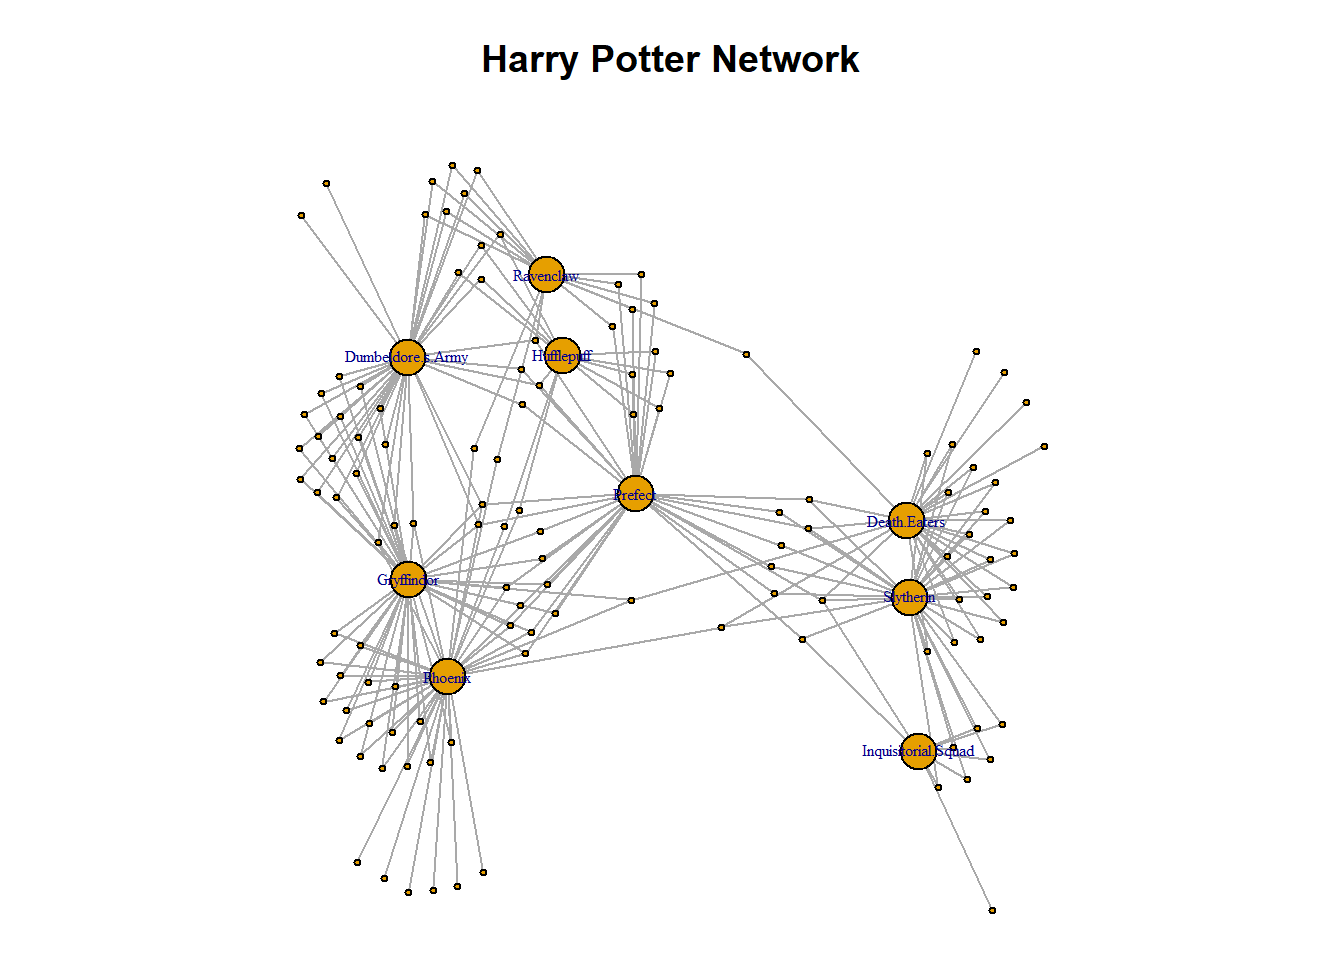
Two Mode Edgelists
There is a different approach to bringing in two mode network data from an edgelist than from an adjacency matrix. Instead of a two mode matrix, you may have edgelist data in two mode format. This is, perhaps, a more common structure of two mode network data. Especially if you were to construct a two mode network from a survey. Consider, a survey with questions about groups that people belong to. Simply, you would have a column of individuals and a column with their groups. These can be the ingredients of a two mode network! Take a look at the Harry Potter network data and get a sense of how they look.
hp_tm_edgelist <- load_data("Harry Potter_Two_Mode_Edge.csv")

head(hp_tm_edgelist)
character group
1 Albus Dumbledore Phoenix
2 Albus Dumbledore Prefect
3 Albus Dumbledore Gryffindor
4 Remus Lupin Phoenix
5 Remus Lupin Prefect
6 Remus Lupin GryffindorDifferent from the adjacency matrix, this edge list has one type of node in one column and the other type in the second column. Notice, true to a traditional edge list, the names of individuals repeat for each group they are connected to. The process for getting a two mode network edgelist into a network object beings as the same process as any other network created from an edgelist. Directed is set to FALSE because there is not really a direction between individuals and groups. Rather, the ties are a marker of affiliation.
hp_tm_net <- graph_from_data_frame(hp_tm_edgelist, directed = FALSE)At this point, we have a network that is familiar to you by now. However, we know that this is actually a two mode network. We can use the bipartite_mapping() function to transform this into a two mode network. This function goes through the edgelist an checks that the columns have distinct nodes in them (i.e. it is truly a bipartite or two mode network). See the code here and run it yourself. It provides a TRUE or FALSE statements for each node in the network similar to the ‘type’ characteristic we use above. We need to add this information to our network.
bipartite_mapping(hp_tm_net)So, this function recognises that there are two types of node in this object. We can set that as a vertex characteristic to convert this network into two mode. It mirrors the logic of what we saw above with the ‘type’ characteristic. In turn, this can change the network from a one mode to a two mode network if we set it as a network characteristic. We do this by using the V() operator to create the “type” characteristic and setting it to the “type” output from the mapping function.
V(hp_tm_net)$type <- bipartite_mapping(hp_tm_net)$typeNow we have changed it into a two mode network and added the characteristic ‘type’ that we are familiar with from working with an adjacency matrix like we did above. See below, you see the true and false statements, as we expect to see.
V(hp_tm_net)$type [1] FALSE FALSE FALSE FALSE FALSE FALSE FALSE FALSE FALSE FALSE FALSE FALSE
[13] FALSE FALSE FALSE FALSE FALSE FALSE FALSE FALSE FALSE FALSE FALSE FALSE
[25] FALSE FALSE FALSE FALSE FALSE FALSE FALSE FALSE FALSE FALSE FALSE FALSE
[37] FALSE FALSE FALSE FALSE FALSE FALSE FALSE FALSE FALSE FALSE FALSE FALSE
[49] FALSE FALSE FALSE FALSE FALSE FALSE FALSE FALSE FALSE FALSE FALSE FALSE
[61] FALSE FALSE FALSE FALSE FALSE FALSE FALSE FALSE FALSE FALSE FALSE FALSE
[73] FALSE FALSE FALSE FALSE FALSE FALSE FALSE FALSE FALSE FALSE FALSE FALSE
[85] FALSE FALSE FALSE FALSE FALSE FALSE FALSE FALSE FALSE FALSE FALSE FALSE
[97] FALSE FALSE FALSE FALSE FALSE FALSE FALSE FALSE FALSE FALSE FALSE FALSE
[109] FALSE FALSE FALSE FALSE FALSE FALSE FALSE FALSE FALSE FALSE FALSE FALSE
[121] FALSE FALSE TRUE TRUE TRUE TRUE TRUE TRUE TRUE TRUE TRUEFurthermore, we can replicate our visualisation using the same parameters as above and the network appears as we expect it.
par(mar =c(0,0,3,0))
set.seed(123)

plot(hp_tm_net,
     vertex.label = ifelse(V(hp_tm_net)$type == "TRUE", V(hp_tm_net)$name,""),
     vertex.size = ifelse(V(hp_tm_net)$type == "TRUE", 10,2),
     vertex.label.cex = 0.5, main = "Harry Potter Network")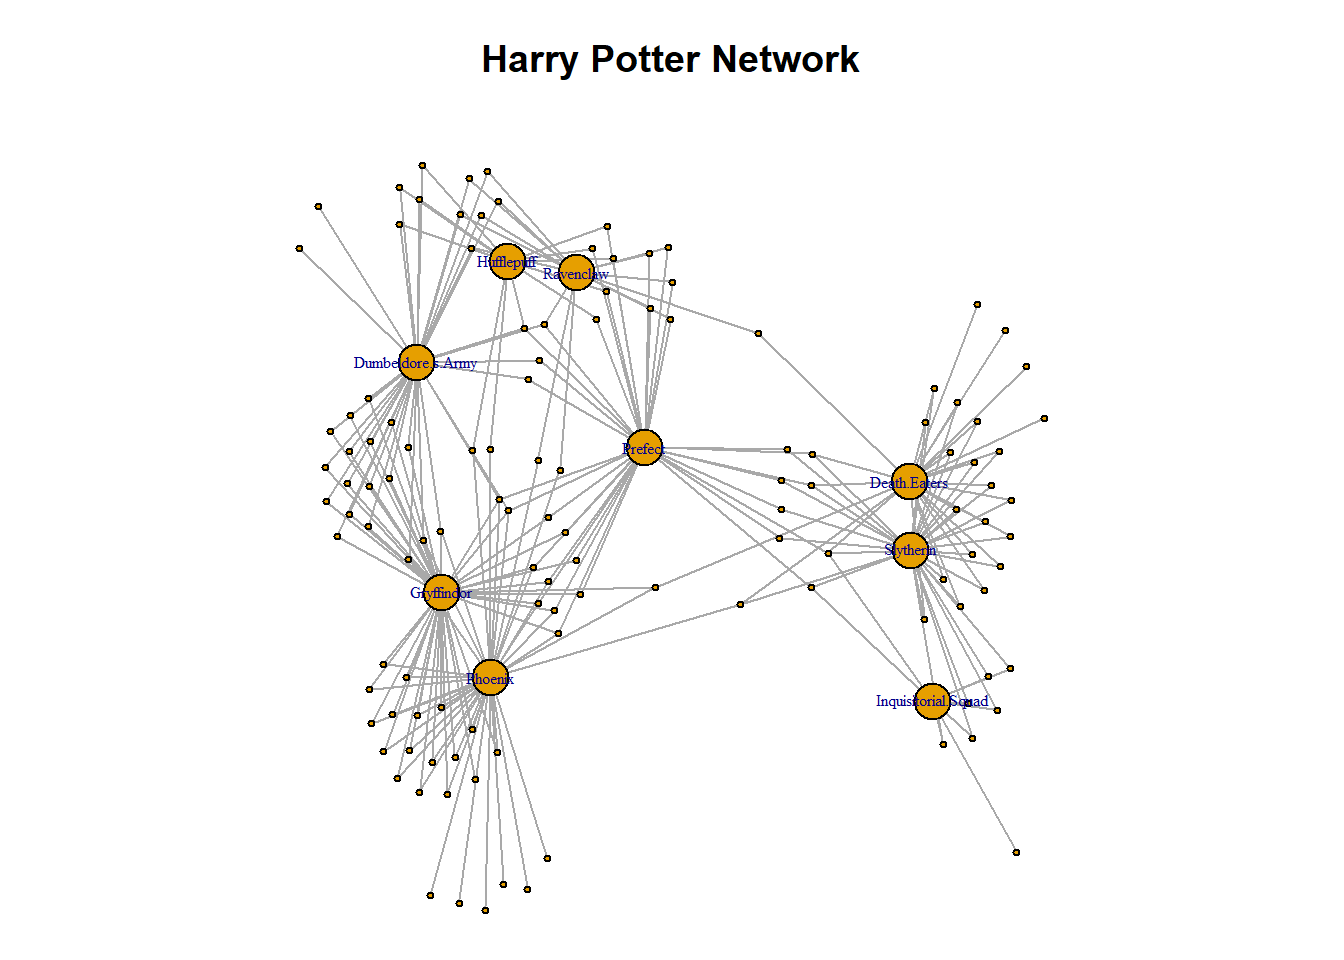
Summary
Final things to remember here about two mode networks are that, just like one mode network data, they can be stored as either a matrix or an edgelist. When bringing in a two mode network from an adjacency matrix, you can convert the data into a network object using the graph_from_biadjacency_matrix() function so long as you have set it as matrix. When bringing in a two mode network from an edgelist, you have to set the bipartite characteristic.
There are many work-related applications to two mode network analysis. Imagine you work for a company and you’re interested in the TV subscriptions of people. From a simple survey, you could collect data on the subscriptions that people have. From this survey you can create a two mode network of individuals connected to their TV subscriptions. This is a much cooler analysis of the market than forecasts, projections and crosstabs (although all useful)!
In this section you have learned:
What two mode data looks like.
How to bring a two mode network (adjacency matrix or edgelist) into R and visualise it.
A very basic way to visualise a two mode network.